Where Data Meets Design

Field notes are full of conceptual ideas, rough sketches, and sometimes lots of numbers.

Which turns into ridiculous spreadsheets…

Somehow, all this needs to be converted into easy to read and interpret results for professional meetings and technical papers.
It starts with a graph, that’s messy and undecipherable.

That’s where I come in. I take your data and tinker with it.
Scientific information design isn’t just about making a graph look better. By exploring different ways to organize and visualize your data, we can clarify relationships, identify patterns, and sometimes discover questions you didn’t know you needed to ask

Every step of the way, we’ll discuss the project and keep polishing the piece for your needs.

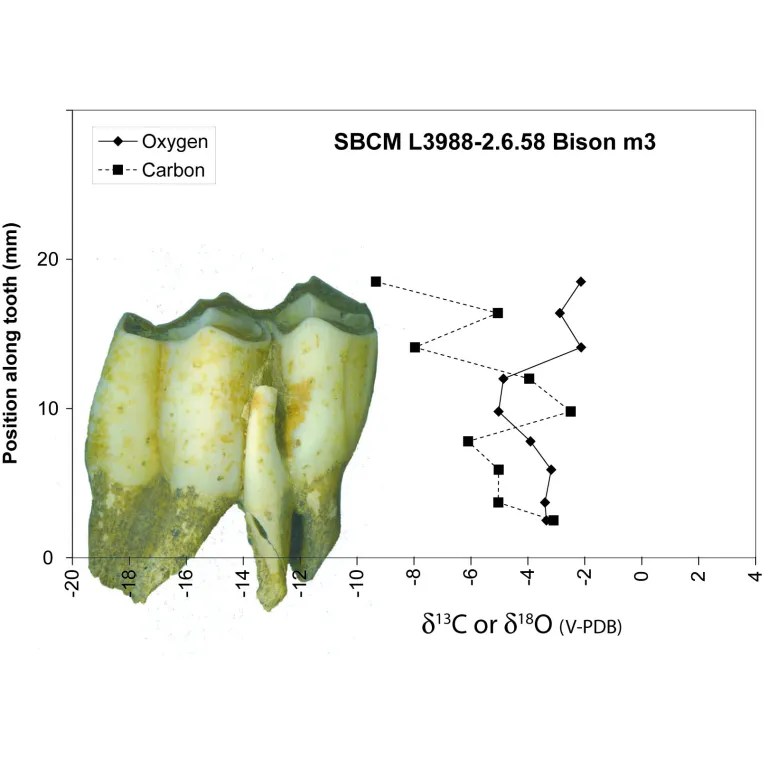
The above is unpublished data – so critical data has been removed.
Here are some complete graphics:


Have data you know are telling a story, but can’t figure out how to show it?
Send me what you’ve got. We’ll figure out what the figure needs to say.